vilsem — A Presentation Layer for Power BI Semantic Models
Author a dashboard once against a Fabric / Power BI semantic model, compile it to a portable JSON spec, and render it on four surfaces — desktop, web, a custom Power BI visual, and Fabric. Open source, MIT, now in public beta.
The gap
Power BI couples two things that don't have to be coupled: the semantic model — relationships, measures, business logic — and the report canvas, which is how it looks, how it behaves, and where it lives.
The model is the valuable part. It's governed, tested, and shared. The canvas is a rendering decision, and it locks you to one surface. Want the same numbers on a public web page, embedded in an internal app, or styled outside Power BI's theming system? You rebuild it — and now two definitions of "revenue" start drifting apart.
Every AI-assisted BI workflow I tried made the same problem worse rather than better. They either generated raw images that Power BI knows nothing about, produced DAX in a chat window and left you to copy / paste / debug it, or hard-coded a single vendor with no escape hatch.
vilsem treats the semantic model as an API. Dashboards are defined separately,
in a portable JSON format, and rendered wherever they're needed. The DAX still
executes against the model through the Power BI executeQueries endpoint, so
every number comes from the place it always did — with measures and row-level
security behaving exactly as they do in Power BI.
What it does
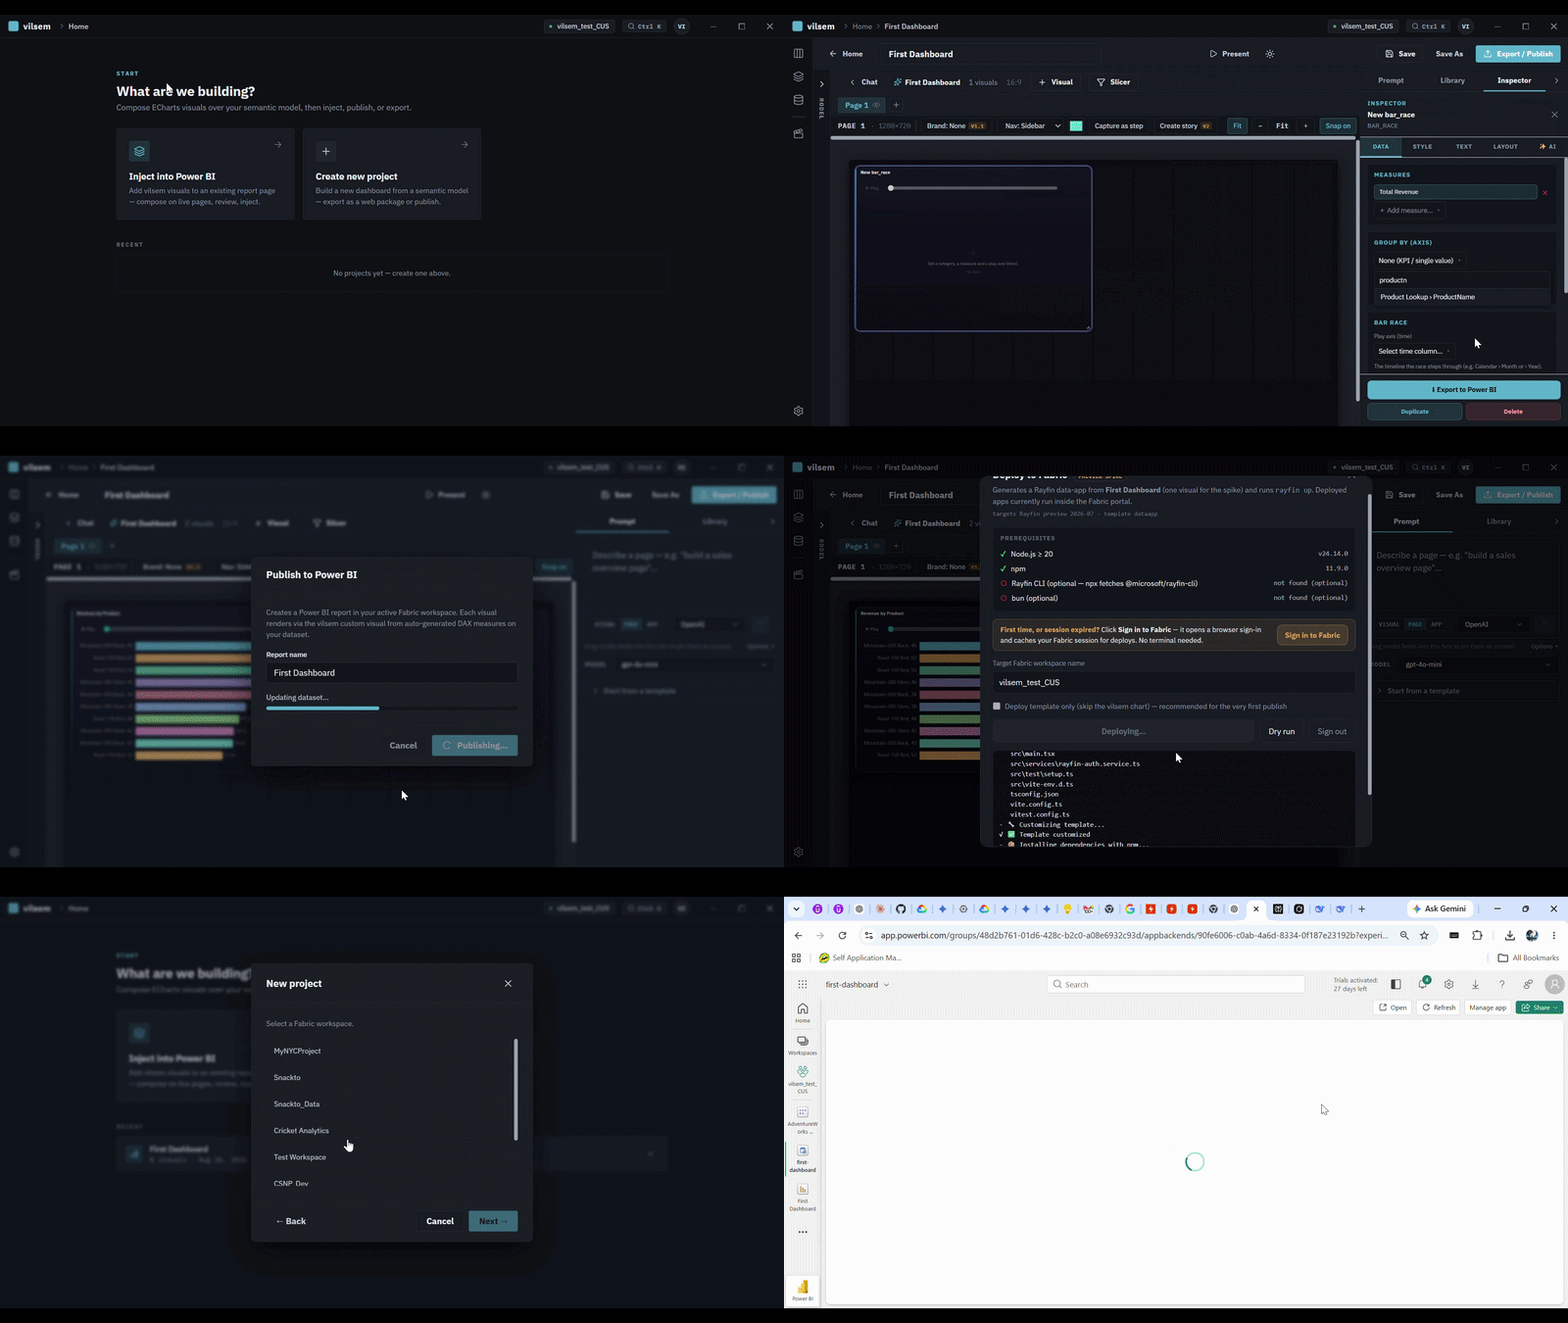
Connect to an existing Power BI / Fabric semantic model — no import, no duplicate storage, no second refresh schedule. Then author a dashboard two ways:
A visual editor. Pick measures and dimensions from the model's metadata, choose visual types, arrange the canvas, set the theme. Everything stays directly editable; nothing is generated behind your back that you can't then change by hand.
A plain-English prompt. "Show revenue by product category for the last 12 months, add revenue and profit KPIs, and show the top 10 products." The model selects measures, dimensions, visual types, layout, and theme — and hands back an ordinary spec you refine by prompting again or by editing it directly. The DAX it produces is visible and editable. Bring your own key: Anthropic, OpenAI, Gemini, or Groq. Without a key the visual editor still works fully.
Both paths compile to the same thing: an App Spec, a portable JSON definition of layout, visuals, queries, and theme.
One spec, four surfaces
| Surface | Output | Status |
|---|---|---|
| vilsem desktop | Interactive dashboard in the Electron app | Available |
| Web | Standalone, self-hostable web application | Available |
| Power BI | Published through a custom .pbiviz renderer | Available |
| Microsoft Fabric | Fabric App deployment | Feature-flagged |
The App Spec is the contract. Every renderer consumes it; nothing else is shared between surfaces. That's what makes a dashboard portable — and what makes adding a fifth target a matter of writing one more renderer.
Cross-filtering, slicers, drill-down with breadcrumbs, detail panels, and axis switching are designed to behave the same on every surface, so a dashboard doesn't quietly degrade when you move it. Because each surface queries the live model at view time, a dataset refresh shows up everywhere the dashboard is deployed.
There are 30+ visual types on Apache ECharts — KPI cards, bar, line, area, combo, waterfall, funnel, heatmap, treemap, radar, sunburst, scatter, tables, animated bar races.
The hard parts
XPress9 / JSZip incompatibility. The conventional path for programmatic
.pbix publishing goes through the import API, which requires Microsoft's
XPress9 compression — and that conflicts with how every JavaScript Zip library
packs data. After two days of dead ends I found that the Fabric Items REST API
exposes an updateDefinition endpoint that accepts .pbip source format
directly. It's the cleanest publish path I've seen, and almost completely
undocumented for this use case.
A 3,374-line monolithic renderer. The first visualization layer was one giant file that branched on chart type. It worked for a demo and was impossible to extend. I planned an eight-phase migration to a primitive-based composition system: instead of "render a bar chart", the generator produces "a flex container with an axis primitive, a series primitive, and a tooltip primitive." That landed at 870 lines across 47 modular files — and, more importantly, new chart types now compose without touching existing code.
Provider-agnostic prompting. Model families want different things (Anthropic prefers structured XML, OpenAI tools work best with JSON schemas, Gemini has its own contracts). The app abstracts a common Plan → Generate → Validate loop and lets each provider implement its own translation layer underneath.
Keeping four renderers honest. The temptation with multiple targets is to let each one grow its own quirks. Holding the App Spec as the only shared artifact — and pushing every surface-specific concern into its renderer — is what stops "the web build" and "the Power BI build" from becoming different products.
Privacy
vilsem has no backend. There's no vilsem server, no telemetry endpoint, and no account to create. Model queries go from your machine to Power BI. LLM calls go from your machine to the provider you configured, with your key. Keys and dashboards stay local. The only network calls are the ones you'd already be making, to services you already have accounts with.
Status
v1.0.0-beta.2 — beta, and labeled that deliberately. The core paths
(connect, author, render, export) work end to end and are covered by tests.
The App Spec format may still change before 1.0, and Fabric deployment sits
behind a flag while it stabilizes. Windows only for now; that's the only
platform it's been tested on. Not recommended for production or sensitive data
yet.
The source is MIT-licensed and public at
github.com/bcsnpc/vilsem — download the
installer from Releases, or build
from source with npm run electron:dev. The installer isn't code-signed yet,
so Windows SmartScreen will warn on first run.
Bug reports and feedback on the App Spec design are the most useful thing right now.
What's next
- Signed installers, and builds tested beyond Windows.
- A more conversational refinement loop that surfaces ambiguity early ("did you mean revenue net of returns, or gross revenue?") instead of guessing.
- A library of named themes that match real enterprise brand systems.
- Stabilizing the Fabric App deployment path out from behind its flag.